
Imagine two teams squaring off in a big game. Call them Blue and Red.
Team Blue is college basketball’s two-time defending national champion led by experienced veterans, three seniors and two juniors. They’re renowned for their deliberate pace, disciplined ball control, and for taking high percentage, quality shots.
Team Red?
The exact opposite. They start four juniors and a senior, have never won a national championship or even appeared in the NCAA tourney, and play a helter-skelter pressing and running game, averaging 92 points during the season.
Red gets off to a dreadful start, missing 13 of its first 14 shots, and 26 of 34 first half attempts. Though they’ve defended well and are only down 8, they head to the locker room with a meager 21 points, 25 fewer than their seasonal first half average.
Red fares no better in the opening minutes of the second half. With 12:28 left in the game, their prospects are dire. Blue is now ahead by 15 and Red’s best player, a consensus 1st team All-American, has scored but a single point.
Meanwhile, Blue is well on pace to match its seasonal margin of victory average of 17 points… and, most importantly, to win a third consecutive national championship.
By game’s end, Blue has dominated Red in virtually every statistical category. In fact, except for turning the ball over more than Red, they are a model of offensive efficiency, outpacing Red in three of the “four factors” that separate winners from losers, first defined by analyst Dean Oliver in 2004, popularized by Ken Pomeroy on his site kenpom.com, and frequently cited by college basketball broadcasters and sports writers ever since.
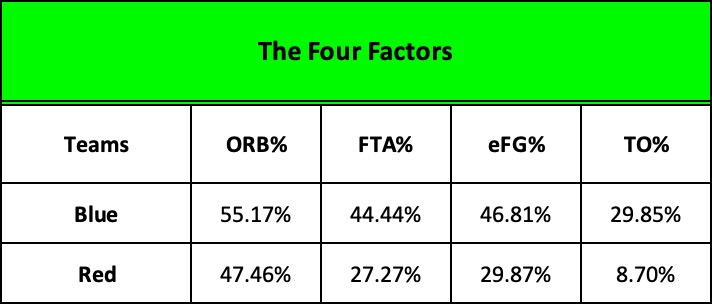
• Not only did Blue out rebound Red, 47 to 41, on the offensive glass they snagged 55% of their misses, leading to additional scoring opportunities.
• From the charity stripe, they more than doubled Red’s “offensive free throw rate,” 44% to 27%. In other words, in proportion to their 47 field goals attempts, Blue got to the free throw line more frequently with a chance to score a greater number of “easy” points than Red did.
• Most importantly, Blue significantly dominated Red in basketball’s key indicator of offensive efficiency and likely victory – “effective field goal percentage” – converting 47% of their field goal attempts to Red’s dismal 30%.
And yet… Blue lost the game.
By now, of course, you’ve likely guessed that Blue versus Red is not an imaginary game but a real one. The actual contest took place sixty seasons ago when Loyola Chicago overcame a 15-point deficit to beat the University of Cincinnati in overtime and capture the 1963 NCAA championship.
The contest is frequently ranked as one of the best tournament finals of all time and was celebrated during last season’s Final Four in a CBS Sports Network / Paramount + documentary called The Loyola Project.
The contest pitted two extremes: the nation’s highest scoring team versus the team that allowed the least.
Loyola was noted for its “iron-man” approach, wearing ankle weights in practice to improve rebounding and using baskets outfitted with special rim inserts that reduced the cylinder by two inches to sharpen their shooting. They relied on balanced scoring with all five starters averaging in double figures and high scoring runs when they would catch fire and bury their opponents in an avalanche of quick points. For example, in their semi-final game against Duke, they were ahead by only three, 74 – 71 at the 4:30 mark, but went on a final run, outscoring the ACC champs 20 – 4 and winning the game by 19. Moreover, throughout the season they seldom substituted, the five starters accounting for 95% of the team’s total scoring. In the national championship game with Cincinnati, Loyola’s starting five played the entire 40 minutes of regulation followed by the 5-minute overtime period. Not a single substitution in 45 minutes of play.
While Loyola coach, George Ireland, liked to run and score, Cincy’s Ed Jucker preferred a slower, more deliberate pace that he honed over five seasons at the helm, winning 80% of his games and capturing two national championships in three attempts. When he took over the head job in 1960, he replaced the Bearcats’ run-and-gun offense led by the legendary Oscar Robertson with a half court attack that stressed high percentage shots. He designed an offense that operated from the center of the cylinder to the foul line, an area circumscribed by an arc of 13 feet, 9 inches. He persuaded his best shooter, All-American forward, Ron Bonham, “that 15 well-selected shots could be as persuasive as 25 random ones.”
Cincinnati entered the game against Loyola ranked #1 in the nation, averaging 70 points while holding its opponents to only 53, and relying on Ron Bonham to carry the offensive load. Over the course of the season, Bonham accounted for 28% of the team’s field goal attempts and makes, and 30% of its scoring… just as Jucker wanted.
To be sure, compared to its seasonal averages, Cincy fell short, but the Rambler’s performance was absolutely dreadful.
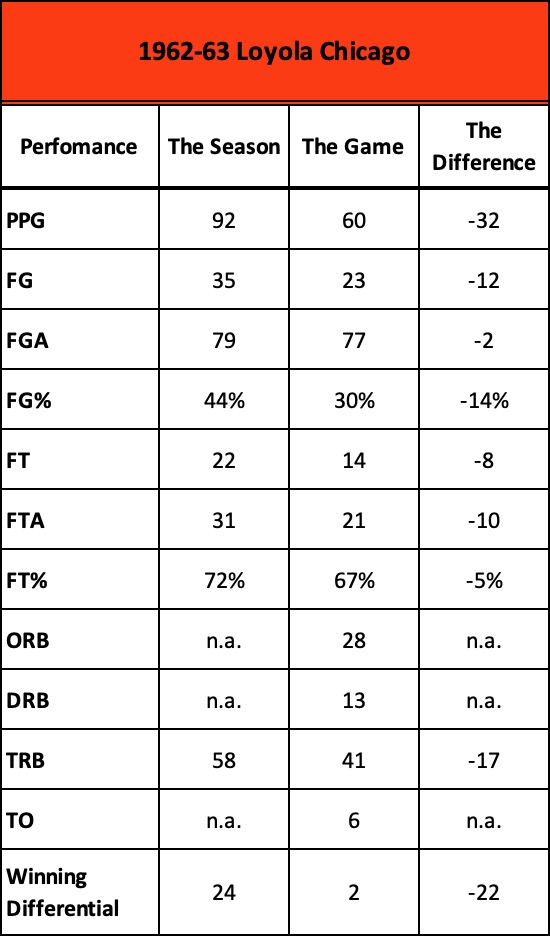
Not only from the perspective of basketball’s traditional stats, but as we have seen, dismal in terms of the game’s modern efficiency stats as well.
How then, did Loyola win?
And why isn’t their victory revealed in the statistical data? How does a team get out-rebounded, shoot an abysmal 30% from the field, and score a whopping 32 points below its seasonal average and yet defeats an experienced, methodical team that played a methodical, fairly efficient game?
The answer is epitomized in the performance of one player, Cincy’s All-American forward, Ron Bonham.
Ironically, his game stats tell a very positive story. He not only carried the offensive load as Jucker proscribed, he out-performed his seasonal averages in every category, sometimes in dramatic fashion, accounting for 34% of the team’s field goal attempts, 36% of its baskets, and 38% of Cincinnati’s overall scoring. He did everything asked of him and more.
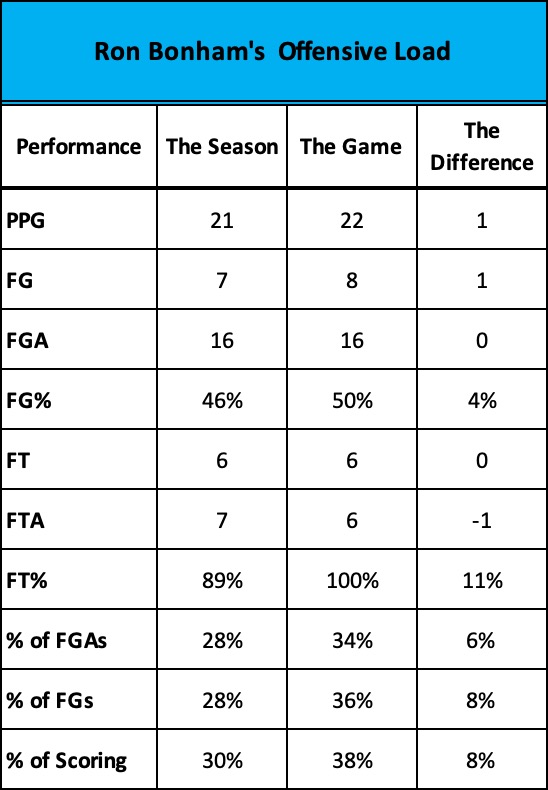
But Bonham’s statistical prowess hides the significance of what actually happened.
He generated all of his offensive firepower in the first 26:43 minutes of play. After making four of his first six shots in the opening minutes of the second half, he never took another shot.
A total of 18:17 minutes ticked off the game clock without a Bonham field goal attempt – 13:17 in regulation, plus 5 minutes in overtime.
Not a single attempt. Zero. Nada.
To put a point on it, consider the following: Ron Bonham, arguably the best, most efficient and productive player on the floor that night, effectively stopped playing.
Over the course of Cincy’s first 43 possessions, Bonham attempted 16 field goals and made 8 of them. But during the team’s final 24 possessions, 19 in regulation, another 5 in overtime, none. He touched the ball only five times.
In effect, for nearly half of the 45-minute game, Ron Bonham was not an offensive threat.
And his teammates?
They fared no better, taking only three shots and scoring a single basket in the final 13:17 minutes of regulation, echoing Bonham’s withdrawal as an offensive threat.
In the opening minutes of the second half, they had gone on tear, making four of five shots and joining Bonham in an 8 for 11, 73% break-out run… and a 15-point lead.
But, then, under orders from the bench, their guns fell silent.
Cincinnati had begun to foul, three of its starters – Wilson, Thacker and Yates – each tagged with four. And Loyola’s pestering full-court defense was disrupting and rushing Cincy’s methodical attack, creating uncharacteristic turnovers. And so, to preserve his starters, slow the pace, and protect his lead, Ed Jucker ordered his team to take the air out of the ball. There was no shot clock in 1963 so each Bearcat possession became a game of keep-away.
Cincinnati was no longer playing to score and win, but playing to avoid losing.
And, Loyola?
In an evening of horrendous shooting, they had no choice. To cut the Cincinnati lead, they had to play frenetic defense, force turnovers, grab offensive rebounds, and above all, keep firing.
Here are several illustrations charting Cincy and Loyola’s possessions in specific time periods. Note in particular the yellow highlighted boxes.
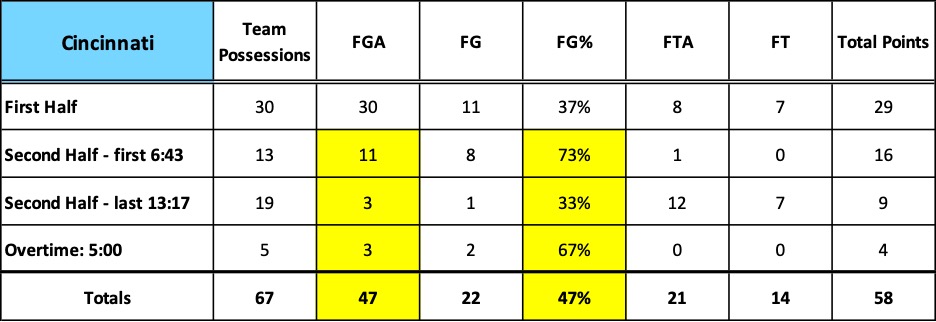
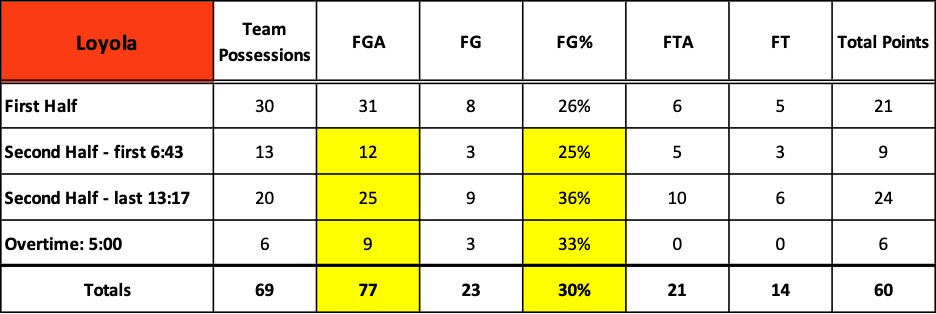
During the second half, Cincinnati converted 64% of its field goal attempts, doubling Loyola’s dismal 32%. In overtime, the national championship in the balance, Cincy did even better, shooting 67% from the field while Loyola managed only 33%.
But look at the shot attempts for each team.
In the game’s final 18:17 minutes, Bonham and his teammates shot the ball only 6 times for 3 baskets while Loyola generated 34 attempts and 12 baskets. In a game where free throws were even – both teams going 14 for 21 – that’s a swing of 18 points.
Yes, by the game’s end, Loyola shot only 30% from the field compared to Cincy’s highly efficient 47%, but the Ramblers fired 30 more times… thirty more opportunities to score and they only needed to make one of them to win the game.
One out of thirty yields an infinitesimal shooting percentage of 3%. But, in this case, it marked the difference between victory and defeat, highlighting the factor that advanced analytics often misses in its quest to measure mathematical efficiency: volume and its impact on effectiveness.
More on this in my next post.