In our recent series of posts, we learned that modern analytics provides descriptors or language in the form of numbers to represent what happens in a basketball game.
On the basis of those numbers, we’re able to evaluate or measure the quality of play, demonstrating how well or poorly a team performed compared to its opponent… and in ways often more revealing than what the final score alone might suggest. In fact, as the data accumulates over a series of games, it exposes a team’s tendencies in such fine detail that we can forecast or reasonably guess the likely outcome of its future games.
But no matter how insightful, the numbers never tell the whole story.
At best, the computations remain an approximation of reality — a mathematical reduction of the lived experience that sometimes misses or even distorts the larger context of how and why things happened the way they did.
In fact, in last week’s post, we argued that the old-fashioned “eye test” may work better than the math as it detects the nuances and context that the numbers often miss.
Not convinced? Let’s take a different tack.
By total coincidence, sixty years ago when Loyola Chicago defeated Cincinnati in the ‘63 national championship we’ve been exploring, I first learned what a school president said to his struggling athletic staff. It’s stuck with me ever since.
“60/40 and an occasional championship.”
That’s what he told them.
Play a competitive schedule, win 60% of your games and an occasional championship, and you’ve achieved athletic excellence.
Run the history of college basketball through that prism and some interesting patterns emerge.
Start with a self-evident fact we seldom acknowledge: on any given night, 100% of time, one team and its coach will lose. Every night of competition, half the participants lose. There aren’t any ties. There’s one winner and one loser, every game played.
Last season, there were 6,159 basketball games played in Division I, pitting teams of varying ability under a variety of circumstances. Teams that had horrible shooting nights or lost their best players to injury, family deaths or tragic accidents; players whose girlfriends had dumped them; coaches whose careers were on the lines; teams that shot the lights out and won their conference championship or a holiday tournament; Cinderellas who upset better squads in the NCAA tourney only to lose in the next round; teams and coaches who fought their way to the Final Four.
Whatever the myriad of reasons, though, 50% of the teams and coaches who competed in those games found themselves on the losing end… 6,159 times.
So, if over the course of a career, you manage to win 60% or more of your games, you join a very small and unique club. And very often, it has little or nothing to do with analytic efficiency.
The popular website sports-reference.com tracks the performance of 490 college basketball teams, spanning 132 seasons from 1893 to the current season of 2023-24. Presently, the NCAA recognizes 363 of these colleges as Division I members: 351 of them are eligible for this season’s NCAA tournament; 11 are currently ineligible because they’re transitioning from Divisions II and III.
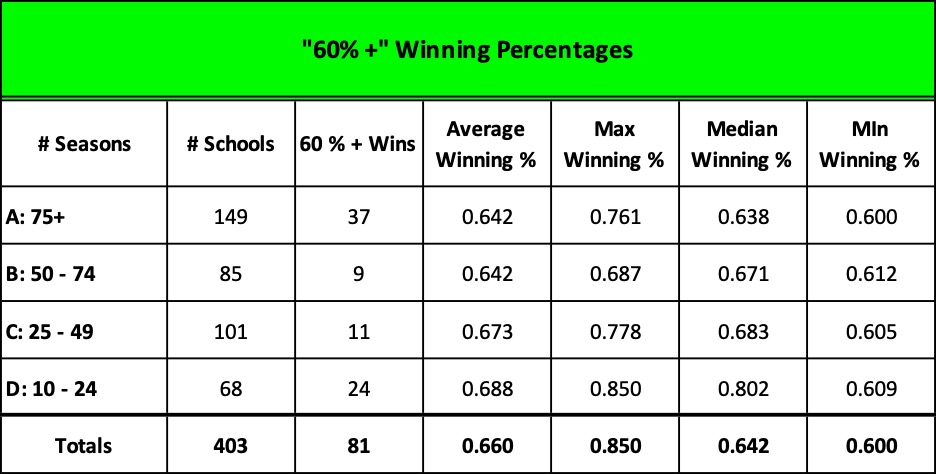
Of the 490 schools, 403 have competed in ten or more seasons. (I’m not including the current, incomplete season.)
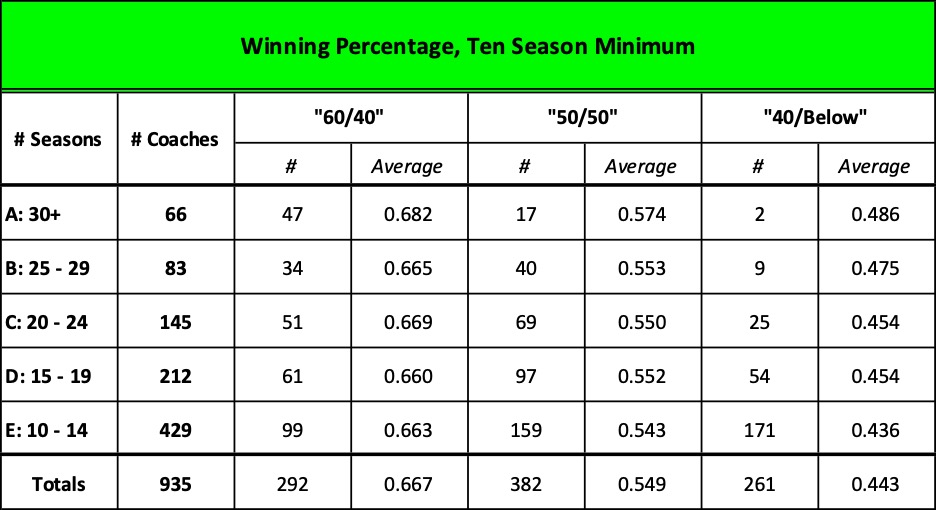
Only 81 of them have won 60% or more of their games. Here’s a breakdown based on the number of seasons in which they’ve played:
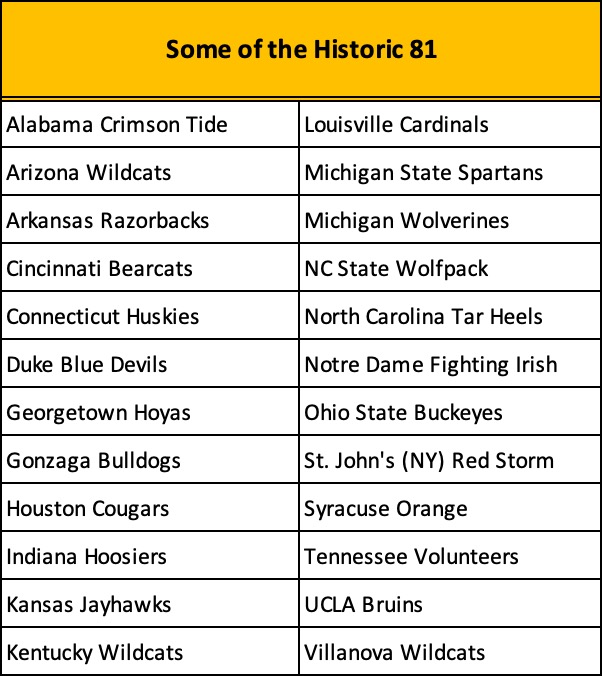
Surprised to see the following schools on the list?
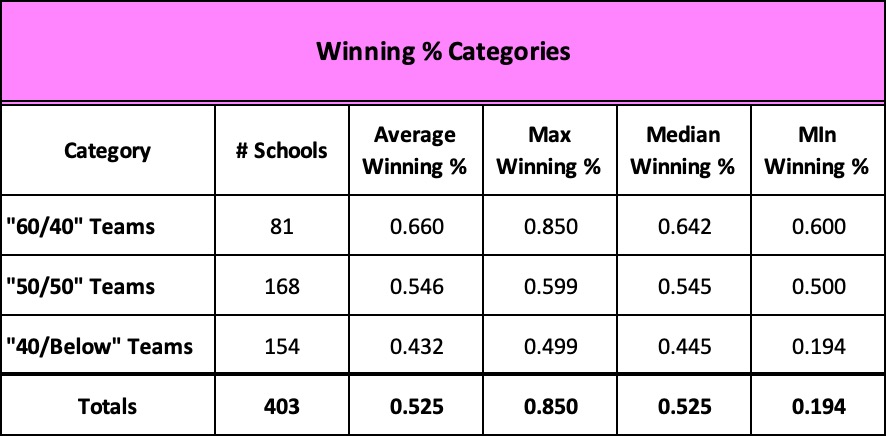
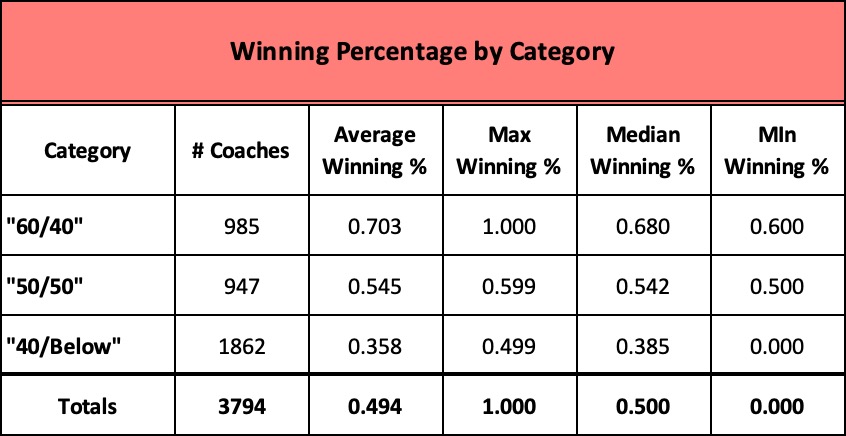
And when we compare the 81 with their 322 competitors whose winning percentages fell below 60%, it looks like this:
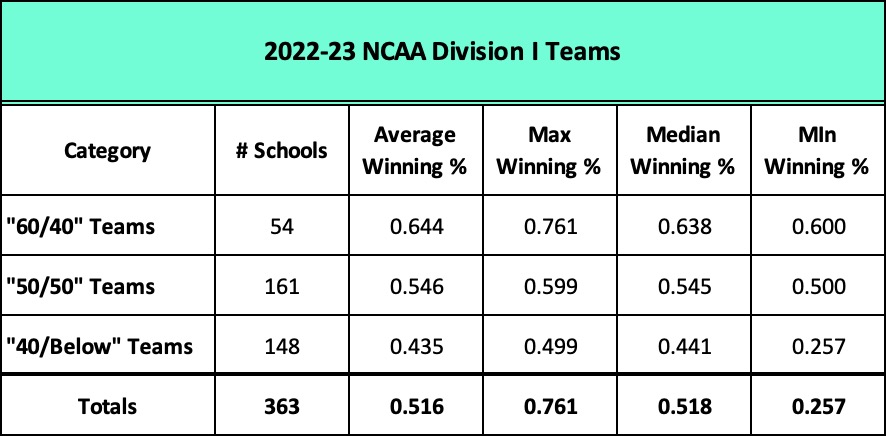
Narrowing our selection to the 363 teams that competed last season, 2022-23, only 54 of them won 60% or more of their games. Every other school – 85% of them — either lost more games than they won, or split their victories with losses.
Winning is not easy. For most teams, it’s a crap shoot. Winning 60% or more of your games over a sustained period of time is extraordinary.
What about the “occasional championship”?
I mentioned that we have historic data on 490 schools since the first official season of college competition 132 seasons ago. Over the years, the number of these schools eligible for invitations to the NCAA tournament and the number of actual participants has varied dramatically for a host of reasons.
For example, during the tournament’s first year – 1938-39 – three different champions were crowned by three different associations: the NCAA, the NIT, and the NY Sports Writers. 161 schools were eligible for the NCAA tourney that year but only 8 received bids, representing eight geographic regions or “districts” that the NCAA had established. Villanova, Brown, Ohio State, Wake Forest, Texas, Oregon, Utah State, and Oklahoma were invited, while Long Island University led by legionary coach and future novelist of the Chip Hilton series, Clair Bee, beat out five other schools in that year’s NIT.
In the years that followed, the three post season tournaments eventually collapsed to two as the NY Sports Writers event fell by the wayside. The NIT continued to battle the NCAA for prominence even as the NCAA gradually tinkered with its brackets and increased the number of participants.
In the 1951, the NCAA tourney expanded to 16 teams and two seasons later, to 22. For the next two decades, the number of participants hovered between 22 and 25, and the NIT slowly declined in stature. By 1975, the NCAA had swelled to 32 teams and nine years later to 64. Finally, in 2011 the NCAA completed its evolution with 68 participants, regional seeding and pods to spread the talent evenly, and an 8-team, play-in or “first four,” leading to the 64-team, single elimination extravaganza we have today.
Regardless of the number of participants and how the brackets were arranged over the years, the tournament has always produced a “final four” – four survivors of the single elimination competition who pair up in semi-final matches culminating in the championship game.
Since that first tournament in 1938-39, there have been 84 Final Fours. (85 seasons in total but the 2019-20 tournament was cancelled because of the Covid pandemic).
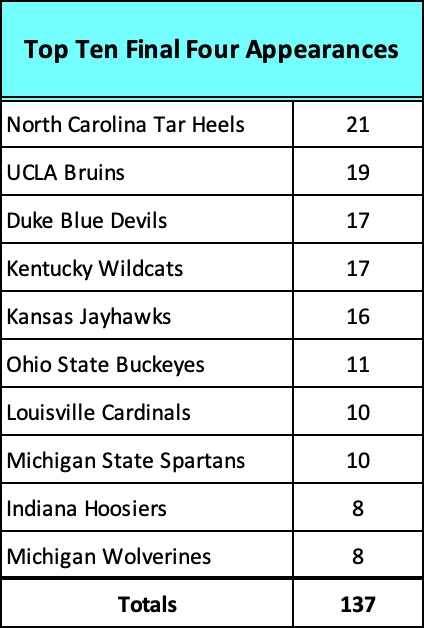
84 Final Fours means that there have been 336 available spots for the last weekend of competition, yet a very small number of schools – 101 to be exact – filled those spots. In fact, a mere ten of those schools account for 137 or 41% of the spots.
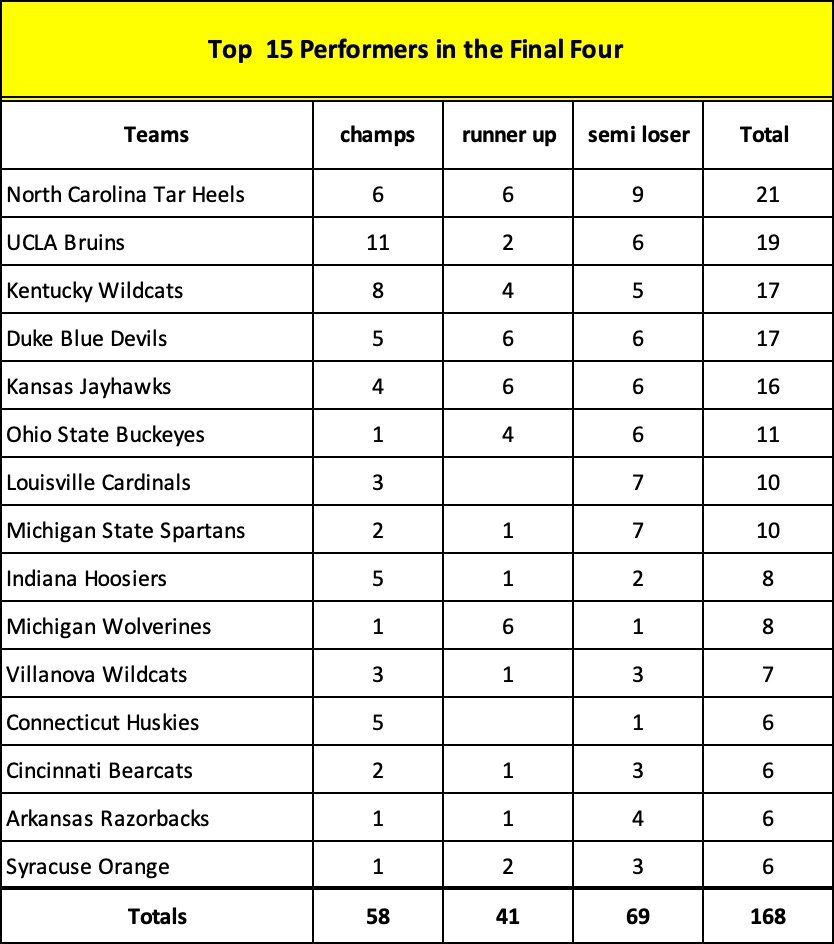
Add five more to the list and you discover that 15 schools own 58 of the 84 championships and 168 or 50% of the Final Four appearances.
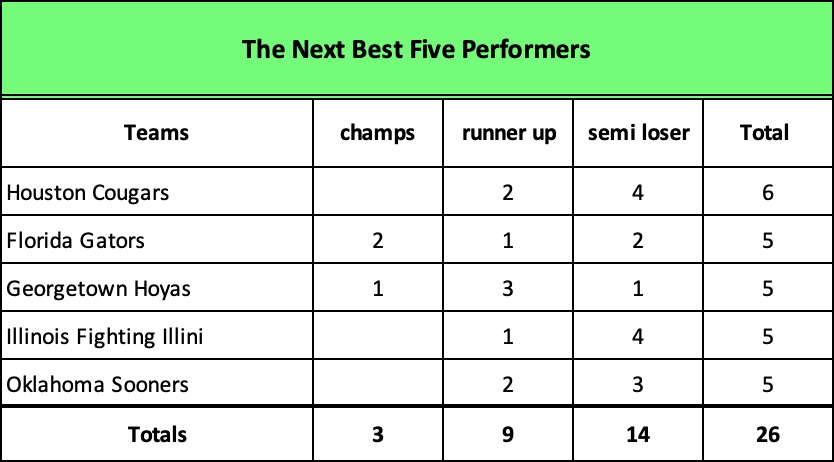
Then, mentally round out the list with the “next best” five performers and…
we arrive at 20 schools that account for 194 or 58% of the available 336 spots … and collectively have won an incredible 73% of the 84 possible championships.
When we shift our perspective from great teams to great coaches, the same pattern emerges.
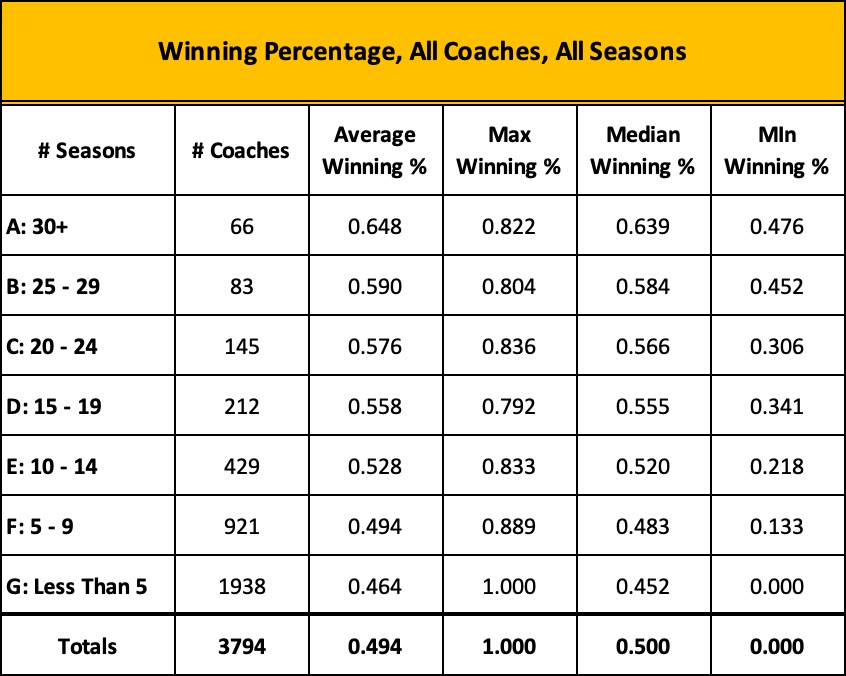
Beginning in 1895 and extending through 2022-23, our last complete season, there have been 3,794 head coaches in college basketball, ranging in tenure from one season to forty-eight. Phog Allen leads the pack with 48 years at the helm – all at Kansas – while 780 coaches served no more than one season.
If we reclassify this list by winning percentage, one-fourth of the coaches make the 60% and higher category.
But if we overlay their years of tenure and examine only those who coached ten or more seasons, the list narrows significantly. Only 31% emerge as members of our “60/40” club.
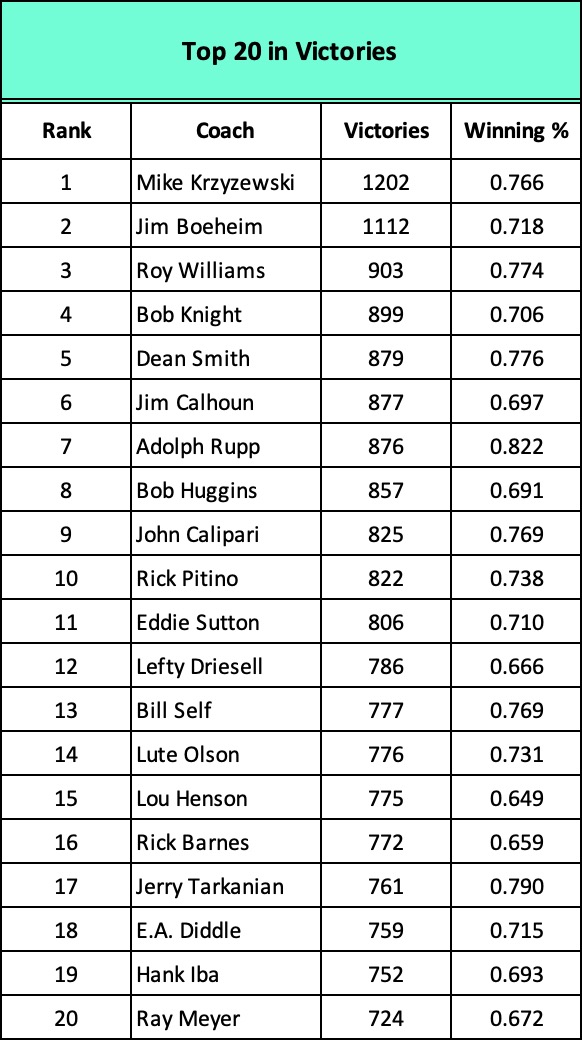
Focus on those who coached 20 or more years and the list holds no surprises.
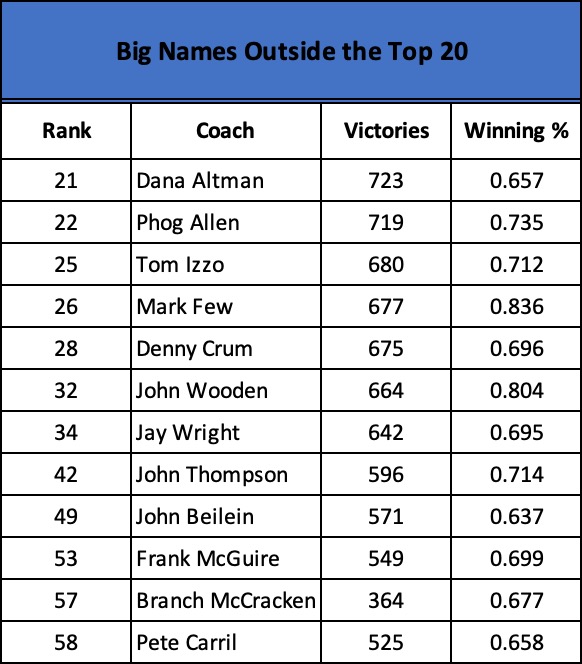
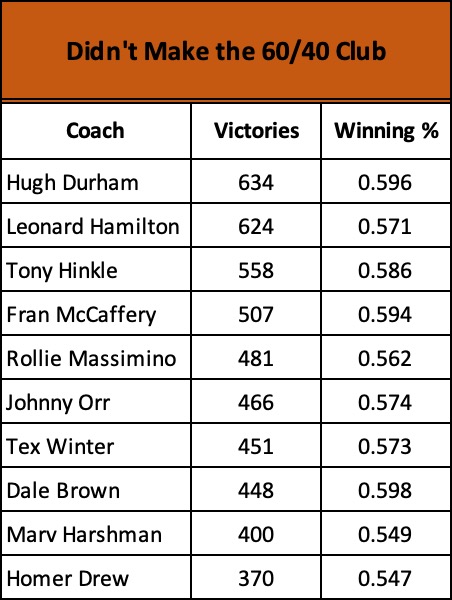
And, then, there are those who don’t make the top 20 but are pretty prominent coaches. Here’s a representative list:
Keep descending through the coaching ranks to those with many victories but not enough to merit “60/40” recognition and you find prominent names like these:
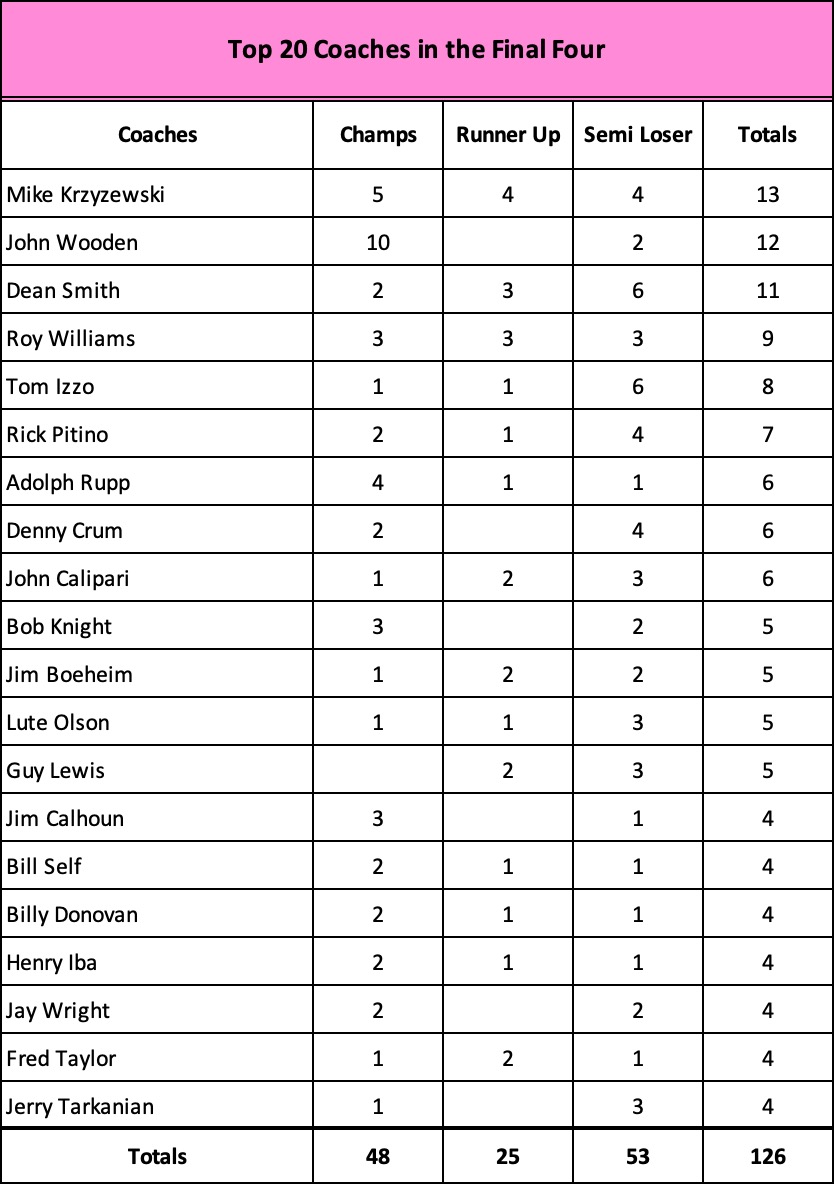
Finally, consider coaches who have dominated the Final Four. Since its inception in 1939, a small cohort of 20 men own nearly 60% of the championships and 40% of the appearances… all of them with career winning percentages of 60% or greater. Unsurprising, they align pretty closely with our list of frequent Final Four teams.
The mantra, 60 – 40 and an occasional championship, is both revealing and compelling, demonstrating that the margin between consistent winning and losing is, indeed, very small.
If over the decades, the same schools and coaches consistently out-performed the competition, then many of their victories necessarily occurred before today’s era of advanced analytics even took hold. The same schools and coaches were apparently doing something right in the years predating analytics, as well as after.
What, then, is the value of advanced analytics?
• Do analytics merely reflect or mirror the results of doing the “right things” or does the data identify strategies for others to emulate… or a bit of both?
• With or without analytics, why do so few schools and coaches reach the “60/40” plateau? What role does sheer talent play? Last season, three newcomers appeared in the Final Four — San Diego State, Florida Atlantic, and Miami — yet none of them had loads of “recognized” talent according to the recruiting services. They were a mixture of older kids, transfers, and diamonds-in-the-rough that the blue blood programs had missed. Yet, in the end, the only true blue blood in the field took home the trophy. As Connecticut’s coach Dan Hurley said, “This isn’t that hard. I have three NBA players and we put the right pieces around them.” What role might analytics play in “managing” the talent that you do have?
• Shortly before his tipoff in last season’s SEC conference finals against Alabama, Buzz Williams, Texas A&M’s coach, talked about the need to contain Alabama’s fast-paced tempo; that 86% of the time, they shot the ball in the first 12 seconds of their possessions. But how is the precision of this statistic helpful? Does it reveal anything “operative” as to how Texas A&M might respond beyond what a simple eye test would have suggested? Alabama plays fast. If Alabama fired in the first 10 seconds or the first 14 seconds of their possessions, 75% instead of 85% of the time, would it change Williams’ response? What is the point of diminishing return in knowing such precise data?
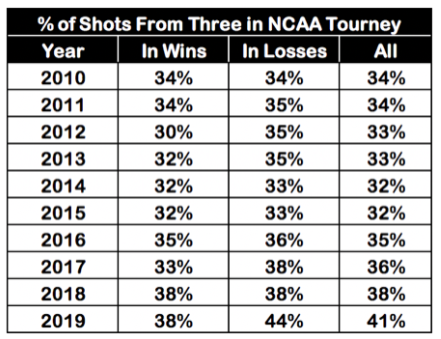
• Speaking of Alabama, can strict adherence or even blind obedience to data hurt a team? Since his arrival in Tuscaloosa in 2019, Nate Oats has built a highly talented roster and taken them to the NCAA tournament three seasons in a row. From the beginning, he has enthusiastically preached a fast-paced, high scoring strategy that religiously ignores midrange jumpers in favor of more efficient 3-pointers and shots at the rim. Yet Alabama has been bounced unceremoniously from the tournament each year, including last March when they were the overall #1 seed. In ‘21, as a 2-seed, they lost to 11-seed UCLA; in ’22 as a 6-seed to 11-seed Notre Dame; and then last year, upset by 5-seed San Diego State. In those three loses they fired 39% of their shot attempts from 3-point range and shot a dismal 22.7%…. including 3 for 27 last year ….Is there a lesson here?
• Analyst Seth Partnow points out that generally speaking, the worst team in the NBA starts every game with a statistical baseline: 80 points, 25 rebounds, and 10 assists. In other words, if you’re good enough to play in the NBA, a team comprised of such players is going to start each game with this baseline in place. The worst team comprised of the worst players in the league is going to make some shots and free throws, probably enough to score at least 80 points, and pick up 25 rebounds and 10 assists in the process. What is the baseline for college basketball? And what are the marginal differences between the baseline and the game’s consistent winners?
These are just some of the questions I wish to explore in the weeks ahead.