As we saw in our last post, Speed Kills, modern analytics often misses the big picture.
Just like the data revealed in a traditional box score, today’s enhanced efficiency stats remain only an approximation of reality, a representation that never fully captures the entirety or whole of what takes place in a basketball game.
Moreover, in its zeal to eliminate the bias or tempo from its representation, advanced analytics unintentionally hides or masks the operational pace of play – the relative rate of speed or intensity at which things occur during each team’s possessions.
Instead, analytics harmonizes or levels out the mathematical differences of each team’s pace of play by counting the game’s possessions in a particular way. Because a shot attempt followed by an offensive rebound is tallied – not as a new possession – but as the continuation of the current one, each team ends up with the same or about the same number of possessions.
Team A advances up the floor and attempts to score, followed by Team B making its own attempt. In this manner, the teams “take turns,” alternating possessions until the game clock expires and one team has scored more points than the other. This makes it easy to measure the outcome of each possession, identifying which team got the most out of its respective turns with the ball.
For example, in a game of 130 possessions, 65 a piece, if Team A scored 80 points to Team B’s 70, Team A not only won the game, on a possession-by-possession basis, it performed more efficiently, producing an average of 1.23 points each time it had the ball while Team B yielded slightly less, at 1.07. A suite of additional efficiency stats flows naturally from this statistical baseline, offering insight into Team A and B’s respective performances – offensive rebounding ratio, effective shooting percentage, turnover rate, and the like.
In all, though, the flesh and blood, real or actual pace of the game is artificially constrained so that the faster or slower tempo of the either team does not skew the mathematical outcome of the comparison.
The fact that one team approaches the game in a risk-adverse, slow and deliberate manner while its opponent gambles with a full-court, trapping defense, denies every passing lane in the half court, runs the ball up the floor to generate quicker shots, and when it misses, rebounds furiously to garner additional shot attempts, is ignored in the data.
And yet, those stylistic differences often separate victory from defeat, at times rendering today’s efficiency stats irrelevant, if not meaningless.
We saw this in our exploration of the 1963 NCAA championship game when Loyola Chicago overcame a dismal 30% shooting performance and a 15-point deficit to win the national title. Even though both teams enjoyed roughly the same number of possessions and from an analytic standpoint, competed at the same rate of tempo, the Ramblers generated 30 more scoring opportunities than their “more efficient” opponent.
But here’s the rub.
While today’s efficiency stats often mask the stylistic differences that distinguish a game’s true, operational pace, the human eye detects them immediately… perhaps not in fine detail, but the general gist of what was occurring in real time.
In the case of the Loyola – Cincinnati contest, a simple eye test revealed all you needed to know: one team stopped shooting while the other continued to fire away; one team committed turnovers while the other seldom lost the ball even though it played at more frenetic pace.
Even casual fans sitting in Louisville’s Freedom Hall that night or watching the game on television could easily grasp what was happening. They didn’t need traditional stats, let alone today’s enhanced ones to comprehend that Loyola was struggling but fearlessly competing to win while Cincy was trying not to lose. Imagine a discussion between two fans sitting side-by-side in the arena:
“Loyola seems to be getting a lot of second shots… they’re not making many but they keep trying.”
“Yeh… and on defense they keep pressing. They’re frustrated and maybe a bit desperate but they’re not quitting.”
“Bonham’s playing a great game… seems to make every shot he takes… but I haven’t seen him take a shot in a long time… and what’s the deal with the Harkness kid? The game’s almost over and I don’t he’s made a shot yet.”
“How many more times is Cincinnati going to throw the ball away?
“Cincy may have started their stall too early… they’re playing the clock instead of playing Loyola and the Chicago kids are catching up.”
There’s a lesson here. The eye test still works.
Human beings are learning machines. Our senses, especially the eyes, process the world around us. To make sense of what we experience, we look for similarities, placing random, discrete observations into mental categories. We put “like” things together – shapes, sizes, causes, effects, events, etc. – seeking patterns or connections between them, and drawing conclusions or inferences about what we have seen. The process is inductive, moving from specific observations to general theories or broad concepts. That’s how we learn.
In basketball, when a team takes possession of the ball, there are really only five things that can happen. In other words, in the course of a game, every one of a team’s possessions will fall into one of the following general categories:
• Team A shoots and scores
• Team A shoots and misses
• Team A is fouled, inbounds the ball and starts again, or is awarded one or more free throws
• Team A turns the ball over, losing possession before it has a chance to score
• Team A shoots and misses but rebounds the ball to continue the possession and get another chance to score.
At the end of each, Team B takes its own turn with the ball and repeats one of the five categories.
A spectator isn’t likely to record these possession types or even be conscious of them, but if you showed him the list and answered a few obvious questions – “Where do you place jump balls?” – he’d likely say, “Yeh… okay, I get it. That pretty much describes what happens in any game.”
He wouldn’t need access to stats or knowledge of modern analytics to know this. The categories are self-evident and as he experiences them in real time, he forms conclusions about the style, quality, and pace of play as the game unfolds. Later on, the game stats may confirm or qualify or in some way sharpen what he has seen, but they’ll seldom replace what his eyes have already told him.
The neat thing about film, of course, is that it extends the eye.
With the help of Loyola University, I got hold of an old VHS copy of the ’63 championship game and digitized it. Understandably, it was granny, a bit jumpy in parts, the narration not always in synch with video, yet very revealing.
The first thing I did was to compose a play-by-play log of the game – a brief set of notes outlining what happened each time the ball changed possession. Basic things: who shot, was it made or missed, an errant pass and turnover, an offensive rebound and another field goal attempt, and the like.
If the camera happened to settle on the game clock or the t.v. announcer noted the time, I recorded those in my play log. And by re-watching film and noting the time lapse count on my computer, I was able to compute and note additional game times for particular exchanges that I felt were important.
The ability to replay portions of the game as often as I wanted meant that I could keep refining my play log until I was sure that I had an accurate account of the game. Unlike the sportswriters and sports information directors who surely created their own logs from the sideline sixty years ago, I had an opportunity to sharpen what my eyes were telling me. How many tips did that kid just attempt? Did someone else get their hands on the ball or does the kid get credit for each of them?
Initially, aside from possession counts for each team, I didn’t attempt any kind of statistical analysis or make any value judgements about what I was seeing and recording. Only after I had transferred my log to an Excel spreadsheet did I run counts of the typical data points found in a traditional box score – the number of field goal attempts and makes, offensive and defensive rebounds, turnovers, and the like.
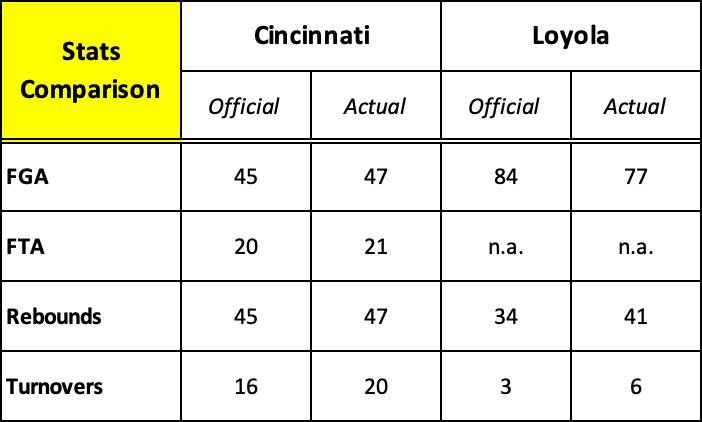
I quickly discovered that the official statistical record of the game found on the NCAA website and sports-reference.com, and widely reported in numerous newspapers and several books over the last sixty years is flawed.

And, then the plot thickened.
Armed with my play-by-play in Excel format, I “tagged” each possession with one of the five “possession types” described above and ran simple counts to see if such groupings or categories might provide insight to the game’s outcome.
Keep in mind that there’s nothing special about these possession categories. As noted above, they’re just simple groupings of “like things” that comprise a basketball game, organizing what the eye has naturally seen: a shot is taken and made, a shot is taken and missed, and so forth. There’s no deep dive into math… no attempt to calculate and compare one team’s “efficiency” score with its opponent. Just simple counts of key actions that occurred in each category.
Effectively, instead of reviewing a game’s possessions in specific time periods – quarters or halves – the five “type” categories provide a way to reexamine the game based on the similarity of actions that made up each possession. In either case, the totals at the bottom of each chart are the same… exactly what you’d expect to find in an old-fashioned box score.
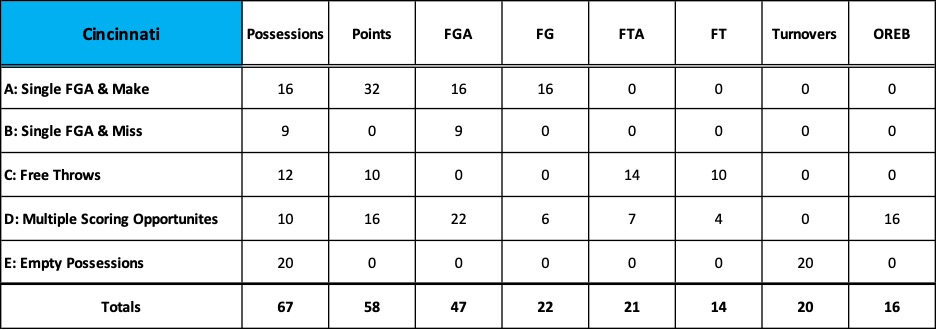
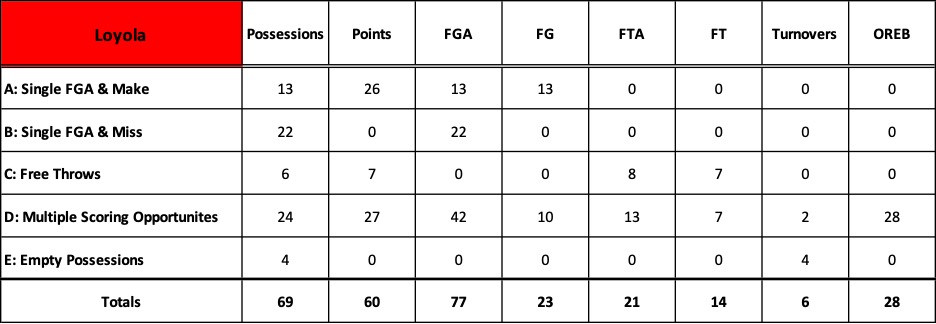
Here’s Cincinnati’s breakdown followed by Loyola’s.


Two categories – B and E – jump out immediately.
• B: Single FGA & Miss: Loyola had 22 possessions in which they attempted a single field goal and missed, while Cincy had only 9. In other words, 32% of Loyola’s possessions generated a shot attempt, but no points. This category is indicative of Loyola’s inefficiency throughout the game. Lots of shot attempts but few baskets.
• E: Empty Possessions: 20 times or 30% of its 67 possessions, Cincinnati threw the ball away and with it, any chance to score. Clearly, Loyola’s pesky defense helped compensate for the team’s horrible shooting night. Moreover, Cincy’s turnovers immediately triggered Loyola possessions in which they attempted 21 field goals, 7 free throws, and scored 17 points. Inefficient shooting, to be sure, but numerous scoring opportunities that Cincy gave away.
But most telling of all is category D: Multiple Scoring Opportunities. This possession type features an initial shot attempt followed by an offensive rebound, leading to additional scoring opportunities within the same possession. The differences here are startingly.

In 35% of its possessions, Loyola snagged 28 offensive rebounds and generated 42 field goal attempts, nearly equaling Cincinnati’s FGA totals for the entire game. Along with free throws, Loyola scored almost half its total points in just those 24 possessions.
Coupled with category E: Empty Possessions, the counts in this possession type reveal the true operational pace of the game. They confirm what the eye immediately grasped: Loyola’s aggressive offensive rebounding and tenacious, disruptive defense produced numerous scoring opportunities that overcame a horrific, inefficient shooting performance. Loyola played at a pace that generated 30 more field goal attempts than Cincinnati and needed only to convert one of those “extra” attempts to win the game.
The eye test and the intuitive leaps it stimulates is often more revealing than statistical analysis because it provides important context.
The ’63 championship game is a dramatic example of the inherent limits of data. My attempt to demonstrate this by zeroing in on a single game does not refute the potency of analytics, but to question our contemporary fascination and sometimes rigid allegiance to it.
Over the course of a season or a series of games, advanced analytics can help us evaluate performance and set quantifiable team goals; it can provide valuable insights to help players improve “on the margins,” but the larger context it so often misses is important, too. Often times, more important.
Imagine a single shot that misses and is rebounded by the defense. From an efficiency standpoint, the possession failed, but did the offensive scheme you designed produce the shot you wanted? Did the right player attempt the shot from the right location and under the right circumstances? If so, then your scheme was well-conceived even though the result was a miss and the possession deemed “inefficient.” A coach can’t dictate outcomes. All he can do is arrange the pieces intended to create the shot he desires; the shot goes in or it doesn’t, but a miss doesn’t necessarily mean his team “ran bad offense.”
This post and the two that preceded it, as well as several more I’ll drop in the weeks ahead, are really about widening the lens… achieving a broader perspective.
Are there other ways to measure performance that may be more revealing than efficiency measurements and comparisons? If analytic data falls short of our expectations, does a solution lie elsewhere? Is there a different, more convincing barometer of performance and predictor of future success?
Stay tuned.
