So far, so good.
The twenty-five rule changes implemented this season – especially those intended to increase pace and enhance “freedom of movement” – seem to be working. We ended last season with only five teams averaging 80 or more points per game, none scoring more than 85. By mid-December this season, seventy teams were averaging 80 or more, seven of them in the 90’s.
Still, I have my doubts. You don’t reverse a forty-year decline in one season.
Just how deep is the hole we’ve dug?
At the tail end of last season I began exploring the steady decline in scoring and pace by returning to the 1969-70 NCAA tournament and comparing the state of the game back then with now. I presented six conclusions:
- The decline in pace and scoring is more severe and longer in duration than most commentators cite.
- The decline started in the college ranks and migrated to the NBA. Efforts to reverse the decline moved in the opposite direction.
- While helpful, rule changes to increase “freedom of movement” and open the floor have not sufficiently addressed the core problem plaguing college basketball – control freak coaches.
- The explosion of television coverage epitomized by ESPN and the rise of March Madness nationalized the game, helped standardize instruction, and dramatically popularized college basketball, but in the process, mythologized the role of “the coach” as the networks searched for an enduring, enticing narrative to exploit.
- Though well intentioned, the introduction of the shot clock and the three-pointer reinforced the shifting emphasis from “player” to “coach” and, correspondingly, from “freedom” to “control.” Scoring dropped accordingly.
- The analytics revolution further cemented the primacy of the coach and led to a mind-numbing sameness in offensive strategy.
In this post and in several to follow, I’ll probe deeper, connecting these dots and demonstrating the significant challenge before us.
Let’s begin with my baseline conclusion: the decline in pace and scoring is more severe and longer in duration than most commentators cite.
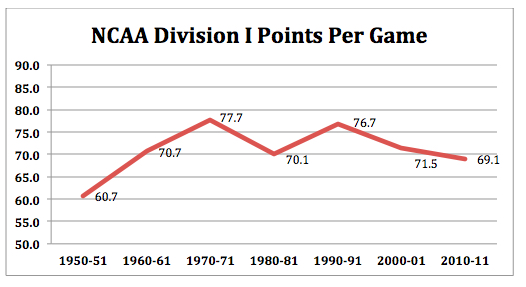
The evidence is overwhelming. By virtually every metric, we see a decline and not just in the last ten or fifteen years as so many commentators note but going all the way back to the early 1970’s. In simple graph form, using ten-year increments, the trend looks like this.
Now, let’s add some definition.
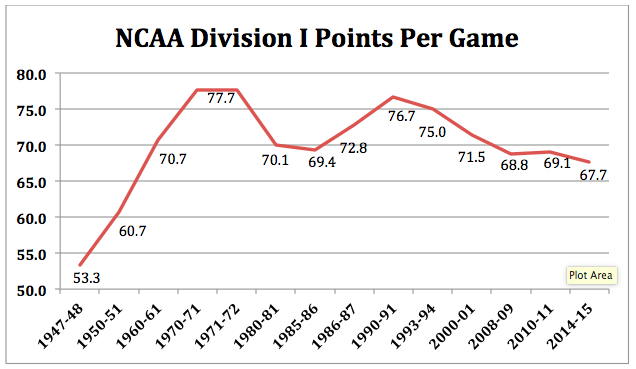
At the front end, start the trend line three seasons earlier with the 1947-48 season, the first for which the NCAA kept uniform statistics; at the back end, add the last four seasons. And, most importantly, during the intervening years insert several historic markers: the introduction of the shot clock and three-pointer in the mid-1980’s and the adjustment of those elements in the 1993 and 2008.
Here’s what emerges:
- Over a period of twenty-four consecutive years, scoring increased an average of 1.02 points per season from 53.3 in 1947-48 to 77.7 in 1970-71 – a total gain of nearly 25 points.
- It held even in 1971-72, then began a 43-year downward slide, punctuated by occasional increases, but culminating in last season’s average of 67.7 points per game.
- With the introduction of the three-pointer and shot clock in the mid-1980’s scoring temporarily rebounded but quickly resumed its downward journey. In fact, the three-point shot’s impact was most dramatically felt only during its first five years of existence when scoring increased from 69.4 PPG in 1985-86 – the last season before the three-pointer was introduced – to 76.7 in 1990-91. Even then, scoring remained a full point lower than its historic high mark achieved twenty years earlier when field goals were worth only two points.
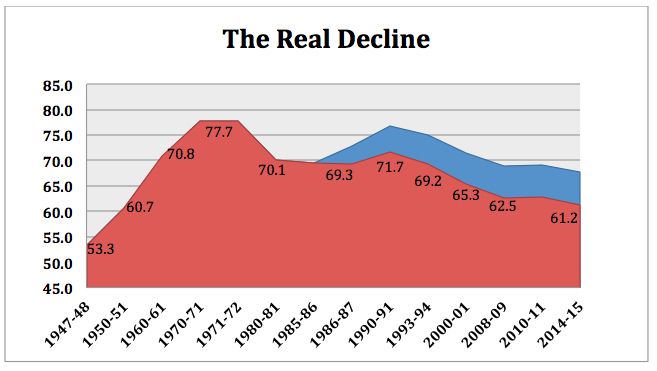
But the decline is actually more dramatic. While analytic purists will surely object, if we convert all field goals back to their original 2-point value, scoring tumbled to 61.2 last season.
Examine the chart below. The red line indicates the scoring trend line when field goals are valued at two points; the blue line reveals the inflation in scoring caused by the three-pointer.
Since its introduction twenty-nine years ago, the three-pointer has artificially added an average of 5.65 points per game to the scoring totals. Last season, it inflated the average score by 6.51 points.
Keep in mind the following: the three-point shot was introduced first and primarily, to reverse the steady decline in scoring that had become the norm by the mid-1980’s, and secondarily, to create the possibility of an exciting late-game changer. Yet, since its inception in 1986-87, scoring has declined at an average rate of 0.23 per season. Despite adding a point to long- range field goals, overall scoring today is nearly ten points lower than its high forty-five years ago. The game-changing impact of three-pointer, dramatically reinforced by incessant highlight playbacks on ESPN, masks this simple reality.
Still not convinced?
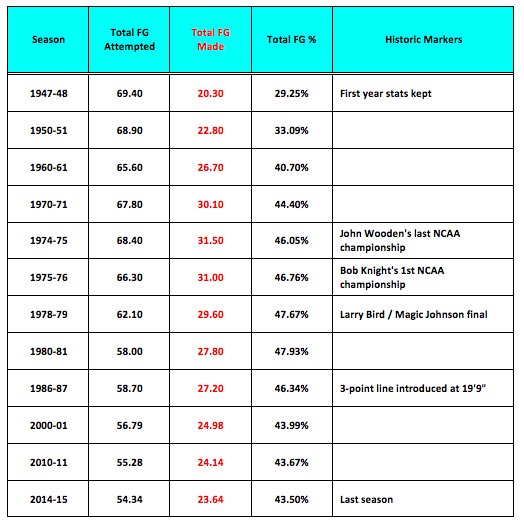
The most telling trend of all – one largely ignored in media commentary – is not the decline in the total number of points scored but in the number of field goals attempted and made.
For 28 consecutive seasons, culminating with John Wooden’s tenth and final NCAA Championship in 1974-75, teams generally scored more baskets per game than they did the year before. By then, the increase in field goals per game had grown to eleven. Teams posted roughly the same number of baskets a season later when Bobby Knight won his fourth Big Ten Championship and his first NCAA title, then began the steady downward slide to last season’s dreadful average of 23.64 makes.
In practical terms, what does this mean?
If you watched a typical college game last season you saw about the same number of baskets as your father or grandfather saw back in 1951-52, an era when many players were still shooting one and two-handed set shots. The fact that some field goals today count for three rather than two is irrelevant.
Basketball is a game of missed shots or more fittingly a game of second shots – what hockey fans call shots on goal. When a young kid picks up a ball for the first time he wants to shoot… and shoot … and shoot. Intuitively he knows that making baskets is what the game is all about. As he matures and refines his understanding of the game, he begins to appreciate its other elements – passing, cutting, spacing, playing defense. But these elements are important only as a means to an end, scoring baskets and preventing your opponent from scoring baskets. They have no intrinsic value beyond this. To be sure, free throws (unguarded penalty shots) contribute to one’s overall point total but no one plays the game for the joy of making free throws. For players and fans alike, from start to finish, the fundamental focus of the game is on making baskets.
Interesting, isn’t it, that when older kids play pickup games, they seldom keep score by counting points. Instead, they count baskets. I’m too far removed from the lived experience to know what it’s called today, but in Chicago they used to call it “West Side” and in the northeast, “Winners.” You play half court 3-on-3 or 4-on-4 and keep the ball as long as you make baskets. First team to 11 or to 21 baskets is the victor, wining the right to keep their spot on the floor to face the next challenger. Two points? Three points? No one tracks the value of the made baskets based on the distance of the shot from the rim. It’s seen for what it is, a contrivance, irrelevant to the natural joy of making and preventing baskets.
Stick with me a bit longer.
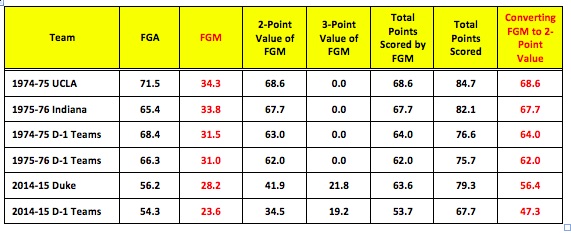
Look at the chart above once again with special attention to three particular seasons – 1974-75, 1975-76, and 2014-15. Then, drill deeper, comparing the national champions in each year with the performance of each year’s Division I teams.
No one would accuse John Wooden, Bob Knight, or Mike Krzyzewski of running inefficient, careless, or “street ball” offenses. No one would accuse their teams of being undisciplined or poor defenders. No one would question their attention to detail or commitment to basketball fundamentals. In fact, we associate all three with the exact opposite.
Yet, look at the disparity in field goal production over the years. Last season, teams attempted fourteen fewer field goals than they did during Wooden’s final season and made eight fewer baskets. Coach K’s championship Duke team averaged 79 points per game last year, only three points fewer than his mentor, Bob Knight, but made six fewer baskets. The gap in total points was closed not by a difference in free throws (about 15 makes per game for both teams), but by the fact that three-pointers inflated Duke’s scoring totals. Convert those inflated points back to their two-point original value and the General outscores his former assistant by a whopping ten points per game. All the more startling when you consider that Knight is the symbolic godfather of both offensive and defensive efficiency – making the extra pass, getting the best shot, reducing turnovers, choking off passing lanes, helping and rotating, preventing second shots.
This season college basketball is engaged in a grand experiment to return basketball to its roots as a game of grace and fluidity, and in the process to reverse the forty-year downward trajectory in scoring. As noted earlier, there are some positive signs that the experiment is bearing fruit.
Keep in mind, though, that we have now entered conference play and the stakes are growing higher. The seventy teams that were averaging 80 or more points in mid-December has now slipped to fifty-five; the seven squads scoring in the 90’s has fallen to one. Most importantly, the real indicators of change – field goal attempts and makes – have barely moved at all: from 54 attempts and 24 makes last season to 59 and 26 today.
As the season tightens and we move closer to March and the NCAA Tournament these figures are likely to erode further.

Good analysis! Also fun reading these….keep them coming!
Cheers,
Tim
Thanks for reading. Really appreciate it!